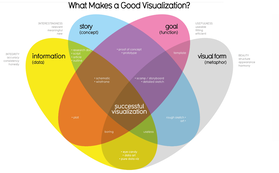
Data Visualization
How to take qualitative and quantitative data and make it immediately comprehensible in a visual form

|
|
|
Please begin by watching this presentation on Data Visualization!


When you are asked to pause the presentation and watch
Hans Rosling's '200 Years 200 Countries 4 Minutes',
please click here to view that video.
Hans Rosling's '200 Years 200 Countries 4 Minutes',
please click here to view that video.
Model Data Visualization
Here is a sample of the type of visualization you might prepare for your class task for today!
You can use landscape or portrait format, and any type of chart format which you think is appropriate for your data.
REMEMBER: your visualization needs to not just show the data in a pretty form, it must have a reason, concept, or story! What is your 'ask'? What is the lesson you want us to learn from looking at your data?
This graphic contains two charts, one pie chart with data collected in my classroom, and one bar chart with data from an American university in 2018.

This chart wants to encourage us to eat breakfast, because there is a link between eating breakfast and better grades!

More Examples and Resources for Data Visualization
http://www.mulinblog.com/teaching-data-visualization- recommended readings and resources
https://informationisbeautiful.net/ - hundreds of beautiful data visualizations
25-tips-to-upgrade-your-data-visualization-design - very helpful and simple advice for young designers!
http://visualizationuniverse.com/charts/ - a large list of different types of charts
https://datavizproject.com/ - even more different types of charts!
https://www.youtube.com/watch?v=jbkSRLYSojo&feature=youtu.be Hans Rosling on 200 Countries, 200 years.
https://youtu.be/ystkKXzt9Wk Aaron Koblin’s Flight Patterns over the USA
The_5_Most_influential_Data_Visualizations_Of All_Time
History of Visualization - from Babylon to Victorian times, and more
https://blog.graphiq.com/finding-the-right-color-palettes-for-data-visualizations-fcd4e707a283
https://designeap.weebly.com/presentation-design.html Colour associations
Quantitative vs Qualitative
Free Resources for Creating Data Visualizations - from simplest to most complex!
https://support.google.com/docs/answer 1 Types of graphs and charts in Google Sheets
https://slidesgo.com/ Free presentation templates for Google Slides or Powerpoint, with hundreds of free icons/graphics at the end of each
10-free-tools-to-instantly-get-started-with-data-visualisation Free tools to create a data visualization - for beginners!
https://www.toptal.com/designers/data-visualization/data-visualization-tools More free tools to create data visualizations
An incredible interactive data visualization
that shows the dialog gender balance
in hundreds of popular movies
(scroll to bottom of page, choose one of the check boxes on the left of the visualization)

